Interchange-Plus vs. Tiered Pricing: Decoding the Real Costs for Merchants in 2026
24 Apr 2026
Interchange-Plus vs. Tiered Pricing: Decoding the Real Costs for Merchants in 2026
The Basics of Credit Card Interchange Fees
Card networks like Visa and Mastercard set interchange fees as the foundation of every swipe, pass-through, or tap transaction, covering rewards, fraud protection, and issuer costs; these rates fluctuate based on card type, transaction method, and merchant category, with averages hovering around 1.8% to 2.2% plus a few cents per swipe according to the latest Federal Reserve Payments Study. But here's the thing: processors layer on their own markups atop this base, creating models like interchange-plus and tiered pricing that merchants must navigate, especially as volumes surge past $10 trillion annually in the US alone. Experts observe that understanding these differences becomes crucial now, particularly with April 2026 marking new compliance deadlines under updated network rules that tighten fee disclosures for high-risk categories.
Take a typical retail swipe: interchange might clock in at 1.51% + 10 cents for a rewards card, yet processors bundle this with assessments and margins, turning raw costs into what merchants actually see on statements. Data from industry trackers reveals tiered models dominated pre-2020, but interchange-plus has climbed to over 40% market share among mid-sized businesses, driven by demands for transparency amid rising e-commerce fraud pressures.
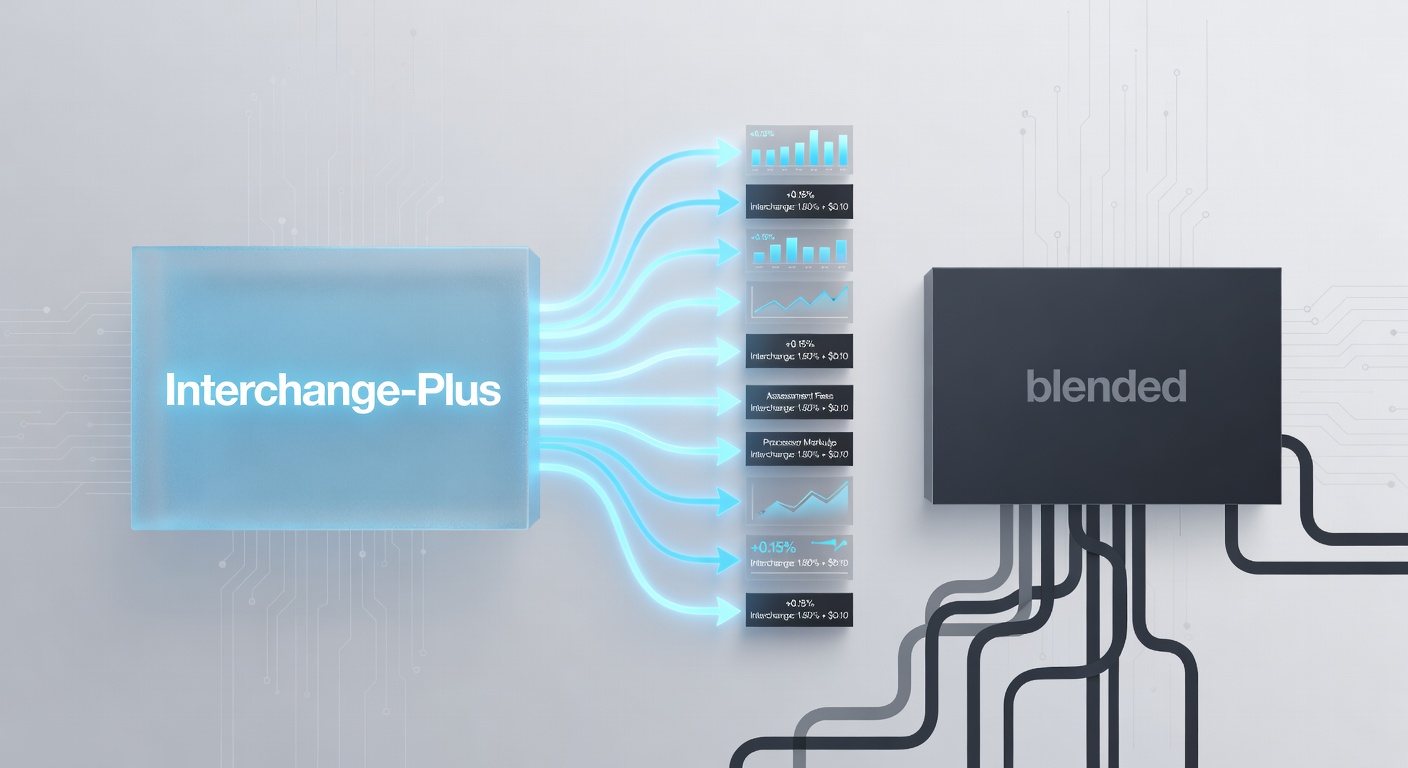
Unpacking Interchange-Plus Pricing
Interchange-plus, often called cost-plus, breaks fees into three clear components—interchange rates passed straight from networks, plus a fixed processor markup (say 0.20% to 0.50% + 5-10 cents), and minor assessments from card brands; this structure shines for visibility, allowing merchants to benchmark against published rates on Visa’s interchange charts, which update quarterly and detail everything from supershopper non-qualified surcharges to contactless EMV incentives. Researchers who've dissected thousands of statements note that high-volume retailers, processing over $1 million monthly, often shave 15-25% off total costs compared to opaque alternatives, since markups stay predictable regardless of card mix.
And while small shops might see blended rates around 2.3% + 25 cents under this model, the real win comes from auditing pass-through accuracy; one case study from a Midwest grocery chain uncovered $50,000 in overcharges after switching, as they finally matched fees to network-published benchmarks. What's interesting is how April 2026's anticipated Canadian Payments Association adjustments—echoing US trends—could lower cross-border interchange by up to 0.15%, amplifying savings for international sellers who favor this transparent path.
Observers point out that processors like those offering interchange-plus must itemize statements monthly, fostering trust; without hidden buckets, merchants spot discrepancies fast, like when a "rewards" Visa debit spikes due to PIN-less authorization rather than processor padding.
How Tiered Pricing Works—and Where It Falls Short
Tiered pricing bundles interchange, assessments, and processor margins into three buckets—qualified (lowest, around 1.5-1.9% + 10 cents for perfect swipes), mid-qualified (2.4-2.7% for keyed entries or rewards cards), and non-qualified (3.2-4.5% for errors like CVC mismatches); card networks define qualification rules strictly, yet processors set the tiers, often inflating mid and non rates to subsidize lows. Studies from the Electronic Transactions Association indicate that 60% of small merchants stuck with tiered in 2023 paid effective rates 0.4-0.8% above true interchange, a gap widening with premium card adoption now at 55% of volumes.
But here's where it gets tricky: a restaurant entering tips offline might push 30% of sales into non-qualified territory, ballooning costs without clear visibility; one Florida e-tailer, processing $500K yearly, switched after discovering tiered blends hit 2.95% versus an actual interchange average of 1.92%, reclaiming thousands through better qualification strategies alone. Turns out, as contactless surges—projected to 70% by April 2026 per Australian Payments Plus forecasts—tiered models struggle, since dynamic rates defy fixed buckets.
People who've analyzed processor contracts often discover clauses burying true interchange data, making audits a nightmare; tiered suits low-volume starters with simple statements, yet scales poorly as card mixes diversify with buy-now-pay-later integrations.
Head-to-Head: Costs, Transparency, and Scalability Compared
When pitting interchange-plus against tiered, data paints a stark picture: for a $100 sale on a standard Visa rewards card, interchange-plus might tally 2.05% + 20 cents (1.65% interchange + 0.30% markup + 0.10% assessments), while tiered slots it mid-qualified at 2.60% + 15 cents, padding an extra 45 cents per transaction that compounds on $1M volumes to $4,500 yearly. Experts crunching Nilson Report figures show interchange-plus edges out for 70% of merchants above $250K annual processing, thanks to fixed markups immune to qualification roulette.
Yet tiered tempts with rock-bottom qualified rates for pin-perfect retail, where 90% swipes qualify; a boutique hotel chain thrived on 1.55% lows until mobile wallets disrupted flows, flipping half to mid-tier overnight. Scalability tips heavily toward interchange-plus, as growing businesses layer AVS, 3DS, and tokenization without fee spikes; Australian Bureau of Statistics payments data corroborates this, with pass-through adopters reporting 18% lower blends post-2024.
- Transparency: Interchange-plus itemizes everything; tiered averages obscure pass-throughs.
- Predictability: Fixed markups beat shifting buckets amid April 2026's EMVCo mandate for tokenized defaults.
- Auditability: One merchant group recovered 12% overcharges via interchange benchmarks, impossible in tiered fog.
Now consider flat-rate hybrids creeping in—2.6% + 10 cents all-in—but they crush low-interchange debit (0.5% base) while undercutting high-end corporate cards; interchange-plus adapts seamlessly, preserving margins across spectra.
Real-World Shifts and 2026 Trends
Merchants switching models report game-changers: a Texas auto parts distributor dropped from 2.85% tiered to 2.12% interchange-plus, fueling inventory expansions; such stories proliferate as software platforms integrate live interchange lookups, democratizing access once reserved for enterprises. What's significant is the regulatory tailwind—EU's 2026 interchange caps at 0.2% for debit, influencing global networks, while US processors face CFPB scrutiny on fee stacking, pushing more toward cost-plus disclosures.
High-risk sectors like subscriptions see tiered erode under recurring non-quals, yet interchange-plus stabilizes at markups under 0.25%; one SaaS provider scaled to $20M without rate creep, attributing stability to pass-through purity. And as Apple Pay, Google Wallet dominance hits 40% shares, qualification rules evolve, favoring models that mirror network realities over artificial tiers.
Conclusion
Interchange-plus stands out for its raw alignment to network costs, delivering transparency and savings that tiered pricing increasingly struggles to match amid complex card ecosystems; data consistently shows merchants prioritizing volume and audits gravitate here, especially with 2026's tokenization waves and disclosure mandates reshaping statements. Those digging into statements first uncover the truth—where fees flow predictably versus getting bucketed into uncertainty—and that's where long-term control begins. As processing hits new peaks, the choice boils down to models that evolve with the swipe, not against it.